How to Read a Sieve Analysis Report and Select the Right Filter Media
When it comes to choosing the correct filter media for water treatment, understanding a sieve analysis report is essential. This technical document helps determine whether your sand, gravel, or multimedia media will perform efficiently in your filtration system.
In this blog, we’ll break down how to read a sieve analysis report, explain UC calculation, and help you confidently make decisions about filtration media sizing.
What Is a Sieve Analysis Report?
A sieve analysis is a lab test that determines the particle size distribution of a granular material such as filter sand or gravel. The material is passed through a stack of sieves with decreasing mesh sizes, and the percentage retained on each sieve is recorded.
📋 This test helps you determine:
Effective Size (D10)
Uniformity Coefficient (UC)
Grading distribution
Compliance with standards (AWWA B100, IS 8419, NSF)
Key Terms in a Sieve Analysis Report
1. Retained %
The amount of material that remains on each sieve.
2. Cumulative % Passing
Total percentage of material that has passed through each sieve.
3. Effective Size (D10)
The grain diameter at which 10% of the sample is finer. It affects filtration speed and capacity.
4. D60
The grain diameter at which 60% of the sample is finer.
5. Uniformity Coefficient (UC)
A ratio that indicates the uniformity of grain size distribution:
UC = D60 / D10
How to Calculate UC in Filter Media
Let’s say your sieve analysis shows:
D10 = 0.45 mm
D60 = 0.63 mm
Then,
UC = 0.63 / 0.45 = 1.40
A UC between 1.3 and 1.7 is ideal for most filter sands used in pressure filters, RO pre-filtration, and multimedia systems.
| UC Value | Meaning |
|---|---|
| ≤ 1.3 | Very uniform (less permeable) |
| 1.3 – 1.7 | Optimal for filtration |
| > 2.0 | Poor uniformity, inconsistent flow |
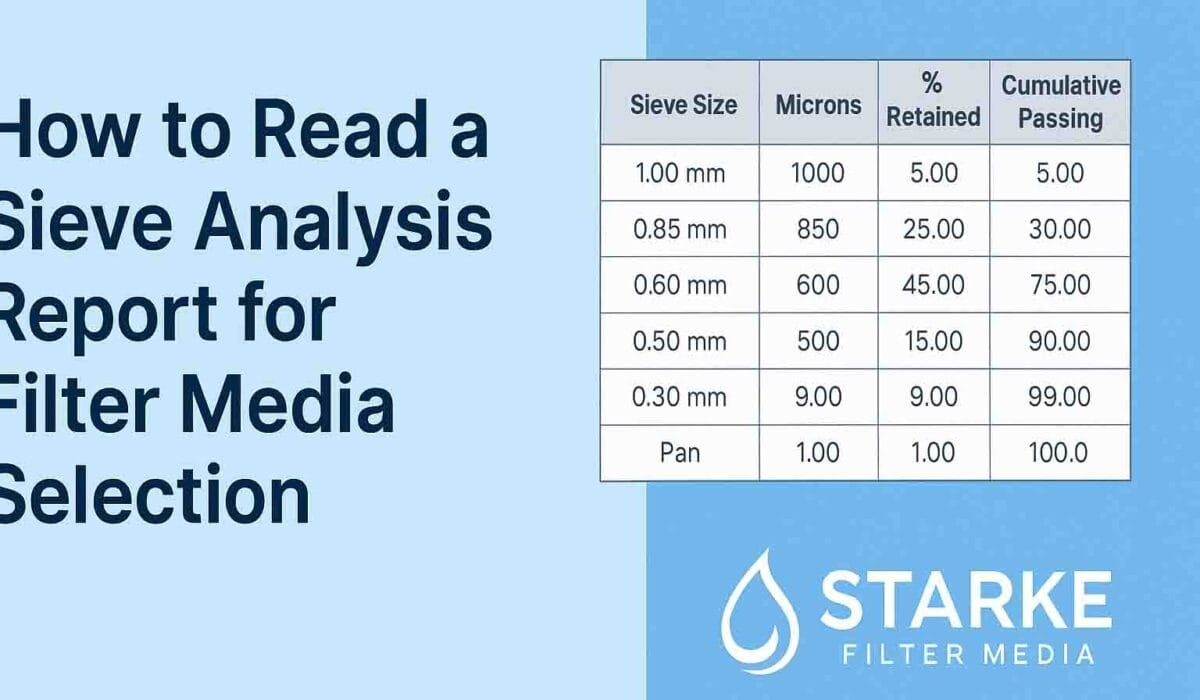
Sample Sieve Analysis Report Table
| Sieve Size | Microns | % Retained | % Cumulative Passing |
|---|---|---|---|
| 1.00 mm | 1000 | 5.00 | 5.00 |
| 0.85 mm | 850 | 25.00 | 30.00 |
| 0.60 mm | 600 | 45.00 | 75.00 |
| 0.50 mm | 500 | 15.00 | 90.00 |
| 0.30 mm | 300 | 9.00 | 99.00 |
| Pan | — | 1.00 | 100.00 |
From this, D10 ≈ 0.50 mm, D60 ≈ 0.70 mm, hence UC ≈ 1.40
Filtration Media Sizing Guide Based on Sieve Analysis
| Application | Recommended D10 | UC Range |
|---|---|---|
| RO Pre-Filters | 0.45 – 0.55 mm | 1.3 – 1.6 |
| Dual Media Filters | Sand: 0.5 mm, Garnet: 0.3 mm | Layer-specific |
| Multimedia Filters | Sand, Anthracite, Garnet combo | ≤ 1.7 |
| Swimming Pools | 0.4 – 0.6 mm | ≤ 1.7 |
| Wastewater/STP | 0.6 – 1.2 mm | ≤ 2.0 |
🎯 Pro Tip: Always request the sieve curve graph from your media supplier to verify consistency.
Why This Matters
Understanding sieve analysis helps you:
Avoid poor backwashing and media clogging
Ensure compliance with AWWA/NSF standards
Choose the right filter media for specific water quality challenges
Prevent costly media replacement or system failure
Why Choose Starke Filter Media?
At Starke, we provide:
✅ Lab-certified sieve analysis reports
✅ Filter sand with controlled UC (1.3 – 1.5)
✅ International standards compliance (AWWA B100, IS 8419)
✅ Sizing options from 0.2 mm to 25 mm for all media types
✅ Custom blended media for multi-layer filtration systems
Conclusion
Reading a sieve analysis report may seem technical, but it’s a vital step in choosing high-performance filtration media. By understanding particle sizes, D10, and UC calculation, you can ensure optimal system performance and longevity.
Whether you need sieved silica sand, gravel, or activated carbon, always ask for a complete sieve analysis—and trust certified suppliers like Starke Filter Media.
Need help interpreting your sieve report or selecting the right media?
📩 Email us at info@starkefiltermedia.com or call +91 96670 82698
🔗 Visit: www.starkefiltermedia.com